
Saturday, April 18, 2015
Bad News For Baseball
Washington Post:
Baseball: the Republican Party of professional sports (in a number of ways, not just demographically).
Mid-April Weekend Links
Well, I'm planning on planting a little corn (maybe), but here are some stories to keep your attention for a little while this weekend:
Jason Rabedeaux Was Here - ESPN Magazine
The Ghosts I Run With - SBNation
Who Cares About "Irish" Andy Lee? Or the Search for Brooklyn's Irish Boxing Fans - Vice Sports
Is Someone Stealing Water From California's Delta? - Modern Farmer
Feds Cancel Commercial Sardine Fishing After Stocks Crash - NPR. Not a good sign.
West, Texas Blues - Texas Observer. The near miss stories are terrifying. I know it's more expensive, but how about using urea or ammonium sulfate in place of ammonium nitrate. They have much, much less likelihood of going boom.
Low Prices Cool Boom in U.S. Oil Production - Wall Street Journal. The article matches what I predicted here, that the Bakken and Eagle Ford are declining, but the Permian may keep increasing production for a little while.
Out of the Ashes - Aeon
Volcanoes Are (Still) Not The Cause of Global Warming - Wired. See also, Volcanic Versus Anthropogenic Sources of Carbon Dioxide: An Addendum - Wired. The significant point is that we know emissions from volcanoes can affect global weather (with sodium dioxide in cooling, for instance), so considering how small carbon emissions from volcanoes are compared to fossil fuel emissions, I would think most people could see that we are almost certainly impacting the climate.
How Car-Reliance Squeezes the Middle Class - Citylab
The Nun's Story - Lapham's Quarterly
Inside the Dyson dynasty - Financial Times
How a Malaysian Playboy Controlled the Most Powerful Naval Force on the Planet - Medium
The Mystery of the Missing Evangelicals - Wall Street Journal. Once again, Ted Cruz is full of shit.
How Corporate America Invented Christian America - Politico
Supply-Side Doom In Kansas - Barry Ritholtz. I don't think the true believers will learn a damn thing.
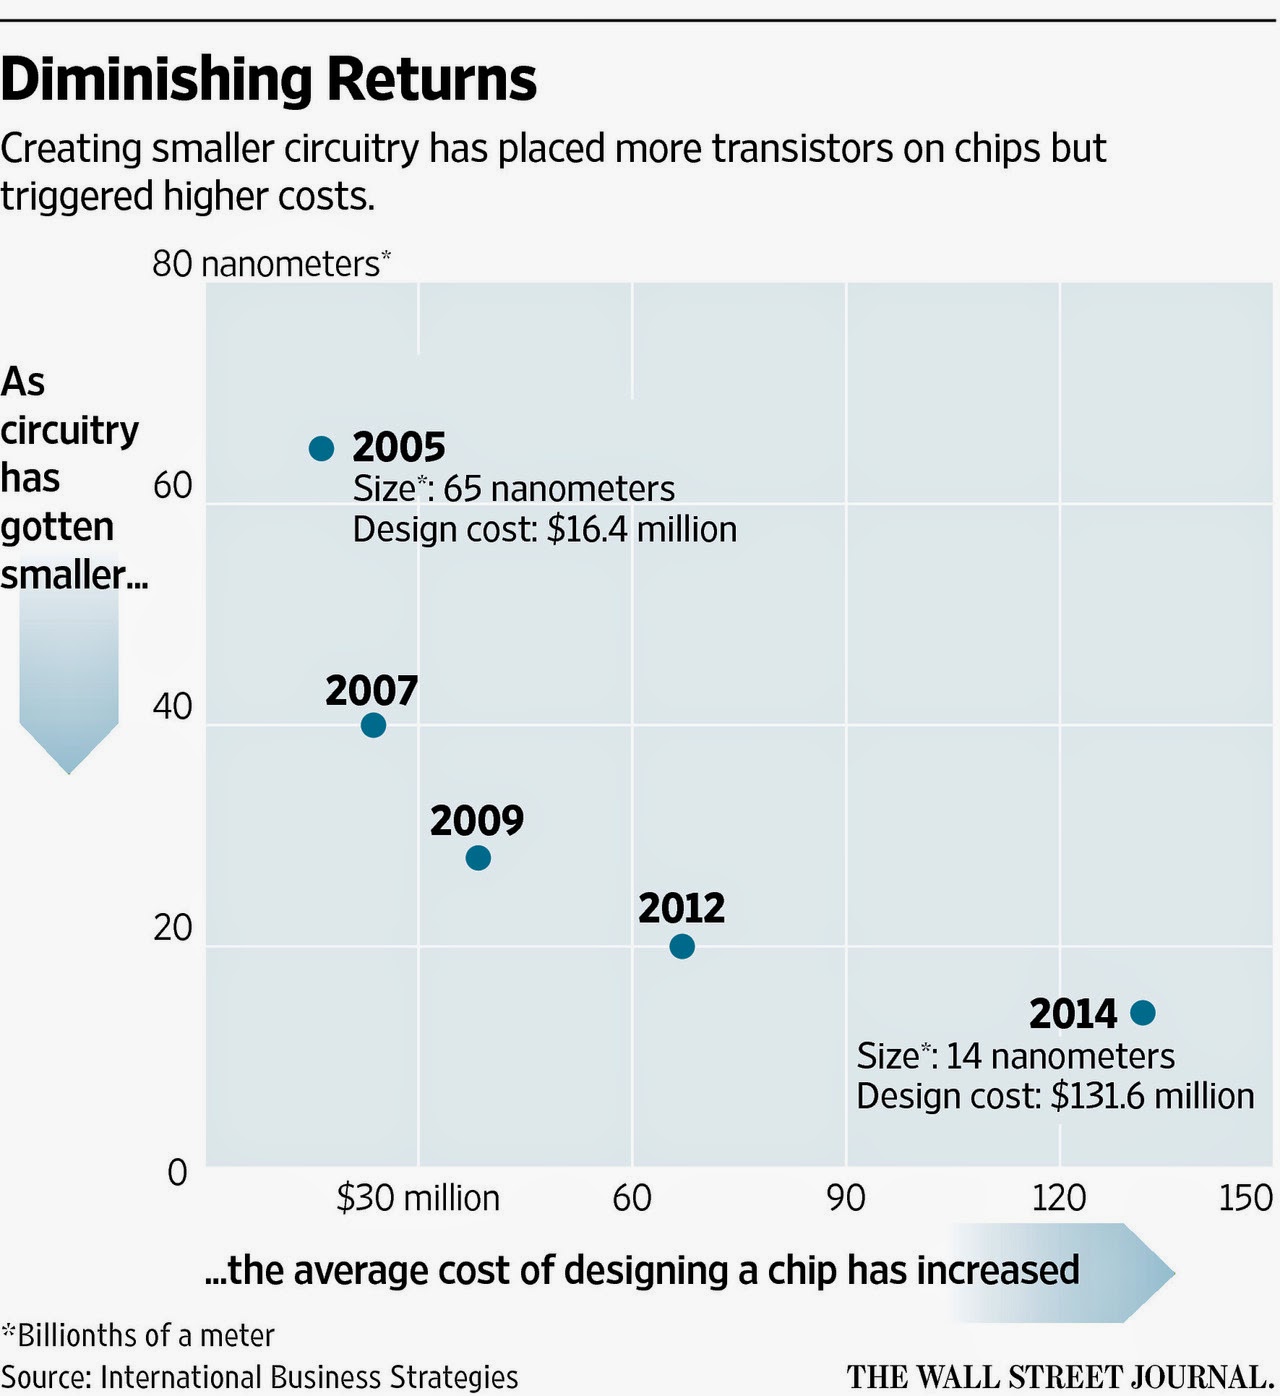
Moore's Law Shows Its Age - Wall Street Journal
Jason Rabedeaux Was Here - ESPN Magazine
The Ghosts I Run With - SBNation
Who Cares About "Irish" Andy Lee? Or the Search for Brooklyn's Irish Boxing Fans - Vice Sports
Is Someone Stealing Water From California's Delta? - Modern Farmer
Feds Cancel Commercial Sardine Fishing After Stocks Crash - NPR. Not a good sign.
West, Texas Blues - Texas Observer. The near miss stories are terrifying. I know it's more expensive, but how about using urea or ammonium sulfate in place of ammonium nitrate. They have much, much less likelihood of going boom.
Low Prices Cool Boom in U.S. Oil Production - Wall Street Journal. The article matches what I predicted here, that the Bakken and Eagle Ford are declining, but the Permian may keep increasing production for a little while.
Out of the Ashes - Aeon
Volcanoes Are (Still) Not The Cause of Global Warming - Wired. See also, Volcanic Versus Anthropogenic Sources of Carbon Dioxide: An Addendum - Wired. The significant point is that we know emissions from volcanoes can affect global weather (with sodium dioxide in cooling, for instance), so considering how small carbon emissions from volcanoes are compared to fossil fuel emissions, I would think most people could see that we are almost certainly impacting the climate.
How Car-Reliance Squeezes the Middle Class - Citylab
The Nun's Story - Lapham's Quarterly
Inside the Dyson dynasty - Financial Times
How a Malaysian Playboy Controlled the Most Powerful Naval Force on the Planet - Medium
The Mystery of the Missing Evangelicals - Wall Street Journal. Once again, Ted Cruz is full of shit.
How Corporate America Invented Christian America - Politico
Supply-Side Doom In Kansas - Barry Ritholtz. I don't think the true believers will learn a damn thing.
Moore's Law Shows Its Age - Wall Street Journal
Thursday, April 16, 2015

A Few Tax Items
Some stories that flesh out our tax system and the politics around it:
Where Your State Gets Its Money - Fivethirtyeight
We Know What's the Matter With Kansas - Big Picture
Among developed nations, Americans' tax bills are below average - Pew Research Center
Republicans push for a permanent aristocracy - Washington Post and Republicans Push $269 Billion Handout for Millionaire Heirs and Heiresses - Huffington Post. Maybe I'm cynical, but I would think eliminating the estate tax and granting the step-up in basis would lead more heirs to sell family businesses than the estate tax itself would. No taxes on the sale would seem to increase the number of sales.
How Much Americans Really Pay in Taxes - Bloomberg
9 charts that explain taxes in America - Vox
State Income Tax Brackets Charted - Flowing Data
Wednesday, April 15, 2015
It's Tax Day
There are actually several things I'd like to post today, but I'm too lazy to turn them out. Expect a post or two in the next couple of days on the subject.
Tuesday, April 14, 2015
And The (Red Queen's) Race Is On
From the North Dakota Division of Oil and Gas:
The strange part is, the news is full of stories about a continuing surge in U.S. shale production. I believe the Permian basin may still be increasing production (and the Marcellus in natural gas), but I anticipate that the Eagle Ford and the Bakken have peaked, at least until oil prices spike again. However, with the lull in drilling and well completion, and the drying up of credit, I think you'll find that Alice isn't able to stay in the same place in the Red Queen's race. I think the EIA and other bullish forecasters are way too optimistic.
4/14/2015Going back to December, 1.163,352 barrels per day were produced from 8,826 wells in the Bakken formation. That is 131.8 barrels per day per well. In February, 1,116,325 barrels per day were produced from 9,208 wells in the Bakken. That's 121.2 barrels per day per well. With creditors realizing that they won't get paid back on all the money they dumped into production over the last 5 years, and with the rig count cut in half, there aren't enough new wells coming on line to make up for the depletion rate of the existing wells.
Director’s Cut
Jan Oil 36,927,131 barrels = 1,191,198 barrels/day
Feb Oil 32,958,640 barrels = 1,177,094 barrels/day (preliminary)(all time high was Dec 2014 1,227,483 barrels/day)
1,116,325 barrels per day or 95% from Bakken and Three Forks
60,769 barrels per day or 5% from legacy conventional pools
Jan Gas 45,678,995 MCF = 1,473,516 MCF/day
Feb Gas 41,267,123 MCF = 1,473,826 MCF/day (preliminary)(all time high was Dec 2014 1,570,858 MCF/day)
Jan Producing Wells = 12,197
Feb Producing Wells = 12,198 (preliminary)(NEW all time high)
9,208 wells or 75% are now unconventional Bakken Three forks wells
2,990 wells or 24% produce from legacy conventional pools
Jan Permitting: 24
6 drilling and 0 seismic
Feb Permitting: 197 drilling and 0 seismic
Mar Permitting: 190 drilling and 0 seismic (all time high was 370 in 10/2012)
Jan Sweet Crude Price = $31.41/barrel
Feb Sweet Crude Price = $34.11/barrel
Mar Sweet Crude Price = $31.47/barrel
Today Sweet Crude Price = $36.25/barrel (lowest since Feb 2009) (all time high was $136.29 7/3/2008)
Jan rig count 160
Feb rig count 133
Mar rig count 108
Today’s rig count is 91 (lowest since January 2010)(all time high was 218 on 5/29/2012)
The strange part is, the news is full of stories about a continuing surge in U.S. shale production. I believe the Permian basin may still be increasing production (and the Marcellus in natural gas), but I anticipate that the Eagle Ford and the Bakken have peaked, at least until oil prices spike again. However, with the lull in drilling and well completion, and the drying up of credit, I think you'll find that Alice isn't able to stay in the same place in the Red Queen's race. I think the EIA and other bullish forecasters are way too optimistic.
Marco Rubio: Back To The Future!

So Marco Rubio has announced his Presidential campaign with a lot of talk about "the new (decade-and-a-half old) century", moving forward and leaving behind the ideas (and, I assume, the Bushes and Clintons) of the last century. But his plans for dealing with Iran and Cuba are to immediately return to the oh-so-successful strategies of the past 35 and 55 years, respectively. Does that strike anyone else as undermining the "new ideas" campaign positioning, or is it just me?
Monday, April 13, 2015
Those Damn Baptists

The Atlantic:
While observations abound about "the rise of America's craft breweries," the story has been very different on the state level. Vermont, for example, had one brewery for every 25,000 residents in 2012. Mississippi, meanwhile, had one for every 994,500. These aren't anomalous islands of booziness and temperance—they're exemplars of their regions. The nine states with the fewest breweries are all in the South. What is it about the region that might make this true?Personally, I prefer areas with large numbers of Catholics (or Diet Catholic Lutherans) and small numbers of Baptists. I'll avoid the South.
In short, it's because of the Baptists. Steve Gohmann, a professor of economics at the University of Louisville, recently published a paper in Entrepreneurship Theory and Practice cataloguing the potent blend of regulation, religion, and corporate interest that makes the South less hospitable to small breweries.
Around the nation, big beer producers contribute to the campaigns of politicians who will support policies that discourage competition from local upstarts—for example, taxes on breweries and laws that prevent breweries from selling their kegs directly to consumers (instead of through a distributor). But what's unique about the South is that there's a voting bloc—the Baptists—whose moral stance against alcohol happens to align with large producers' desires to keep new competitors from getting started in the business. The support of Baptists provides Southern politicians with a reason to hinder brewers that politicians in other regions don't have. As a result, the states with the most Baptists tend to have the fewest breweries.
What Gohmann found is a correlation, of course, but it's a convincing one.
Impacting the Earth, Positively and Negatively
Making the case for the Anthropocene Era, Vox highlights a number of side-by-side images from NASA showing the changes humans have made to our environment, both positively and negatively. They are all worth checking out, but I definitely found this positive one interesting:

Images show concentrations of nitrogen dioxide in 2005 and 2011, from low (blue) to high (red) (NASA, Images of Change)
Not all of the ways we're transforming the planet are negative. Here's some good news: Satellite data from NASA, shown above, revealed a huge reduction in nitrogen dioxide pollution from cars, trucks, power plants, in the United States between 2005 and 2011.Almost all of the improvements along the Ohio River between Pittsburgh and Cincinnati can be attributed to pollution controls on coal power plants and closures of old steel mills (mainly emission controls). The amazing thing is, those power plants deliver the electricity to our state, and yet we didn't see massive price increases from cleaning up the air, in spite of what opponents of regulations claim. I happened to hear a story on On The Media this weekend in which the interviewee noted that with every new environmental regulation, the same critics claim said regulation will destroy the economy, but instead, industry adapts, processes become more efficient, the environment gets cleaner and people live longer. Yet with the next regulation, the exact same claims are made, and nobody points out that the critics were wrong every time before. It is sad, but unsurprising. As some of the more depressing pictures in this series make clear, we are causing irreparable harm to the planet. It is nice to see that we can make some improvements.
Nitrogen dioxide is produced when gasoline gets burned in cars or coal gets burned in power plants. It's been linked to a variety of respiratory problems, and can combine with other pollutants to form smog. It's also a good proxy for pollution more generally.
The EPA first began cracking down on nitrogen dioxide in 1971, and concentrations have fallen sharply over time. Power plant operators have installed scrubbers to remove pollutants from their smokestacks, and car manufacturers have adopted catalytic converters to curtail nitrogen oxides and other emissions. More recently, since 2005, many electric utilities have been switching from coal to natural gas in order to generate electricity.
Cattle vs. Almonds vs. Lawns vs. People
Justin Fox:


Another important point Fox makes is that many, if not most agricultural decisions are warped by subsidies which prevent the market from dramatically impacting farmer decisions. Farmers in California can raise dairy cows, almonds, pistachios, walnuts and alfalfa (for export) because they don't have to pay what the market would bear for water. Farmers in the Midwest raise corn and soybeans even though the market is flooded with supply. They have the RFS providing artificial demand for those crops, and payment programs subsidizing raising corn and soybeans if they are unprofitable (which they are almost certainly going to be this year). Farmers don't have to pay anything toward the negative impacts on water use, water quality, global warming or energy use. As Fox makes clear, almonds are a very inviting, and somewhat overblown target as California suffers water shortage. However, we have to remember that population growth in the entire Sunbelt ignores a lot of the same externalities, and so do our lifestyles throughout the country and the developed world. But, seriously, growing and exporting alfalfa in the Central Valley? That is definitely stupid. But think about it: how much beef and other food products do we waste every day? It has to be a hell of a lot. We probably ought to work on eliminating the waste first, then advance from there.
Here are the top 10 water users among California's crops, compiled using the most recent California Department of Water Resources data I could get my hands on. I averaged data from one year of below-average precipitation, 2009, and one-year of above-average precipitation, 2010.
One thing that stands out is how low many iconic and important California crops are on the list. Strawberries, for example, are part of that 10th-place "lettuce, broccoli" category -- the DWR calls it "other truck" -- which also includes other berries, artichokes, asparagus, carrots, cauliflower, celery, peas, spinach, flowers and nursery products. Tomatoes come in 12th place, onions and garlic 14th, melons, squash and cucumbers 16th.
Meanwhile, stuff that cows eat ranks pretty high on the list. There's alfalfa and pasture, of course. But also destined for livestock forage, according to this presentation by University of California-Davis irrigation specialist Blaine Hanson, is most of the corn, some of the flax and hops category (officially it's "other field crops," and includes sorghum, millet and sunflowers), plus a lot of the grains (which rank 11th in water use). In California, the livestock are overwhelmingly bovine, so put it all together and growing things to feed cattle use more than 10 million acre-feet of water in California in an average year. All the people in California used 8.6 million acre-feet a year in the two years in question. So that's interesting.
Now, the cattle themselves don't consume much water -- direct water use by livestock farmers in California seems to be quite modest. Also, I've already written a whole column about how comparing agricultural water use with urban water use can be misleading. People eat things that take lots of water to grow. People also eat cattle, and drink their milk. Still, it does seem important to understand that raising cattle takes up more of California's water than any other activity.
Then again, selling cattle and their milk is a big-money business in California:
Note that selling hay (aka alfalfa) is a big-money business too. Alfalfa exports to China from California and other Western states are booming, which strikes a lot of people as perverse.Seeding rice fields from airplanes does sound totally cool. However, Fox highlights one of the dark truths of agriculture and diet that I'd rather not discuss: raising and eating meat (especially beef) is extremely inefficient and damaging to the environment.I'd like to think that my cow herd, and my beef-centric diet are entirely harmless, but that just isn't true.
Another phenomenon that strikes a lot of people as perverse is growing rice in California, much of it for export to Japan. As seen in the above charts, rice ranks No. 4 in agricultural water use in Calfornia, but rice doesn't even crack the top 10 in terms of revenue (it's No. 14, with $790 million in sales in 2013). Producing this rice requires leaving fields covered in 5 inches of water for the entire growing season. It also requires dropping seeds onto those fields from airplanes traveling at 100 miles per hour, which sounds totally cool.
Another important point Fox makes is that many, if not most agricultural decisions are warped by subsidies which prevent the market from dramatically impacting farmer decisions. Farmers in California can raise dairy cows, almonds, pistachios, walnuts and alfalfa (for export) because they don't have to pay what the market would bear for water. Farmers in the Midwest raise corn and soybeans even though the market is flooded with supply. They have the RFS providing artificial demand for those crops, and payment programs subsidizing raising corn and soybeans if they are unprofitable (which they are almost certainly going to be this year). Farmers don't have to pay anything toward the negative impacts on water use, water quality, global warming or energy use. As Fox makes clear, almonds are a very inviting, and somewhat overblown target as California suffers water shortage. However, we have to remember that population growth in the entire Sunbelt ignores a lot of the same externalities, and so do our lifestyles throughout the country and the developed world. But, seriously, growing and exporting alfalfa in the Central Valley? That is definitely stupid. But think about it: how much beef and other food products do we waste every day? It has to be a hell of a lot. We probably ought to work on eliminating the waste first, then advance from there.
NASA Photo of the Day
April 8:

Full Moon in Earth's Shadow
Image Credit & Copyright: Rolf Olsen
Explanation:
Last week the Full Moon was completely immersed in
Earth's dark umbral shadow,
just briefly though.
The total phase of the
April 4, 2015
lunar eclipse lasted
less than 5 minutes, the shortest total
lunar
eclipse of the century.
In fact, sliding just within the Earth's umbral shadow's northern edge,
the lunar north stayed relatively bright, while a beautiful
range of blue and red hues emerged
across
the rest of the Moon's Earth-facing hemisphere.
The reddened light within the shadow that
reaches the lunar surface is filtered through the lower atmosphere.
Seen from a lunar perspective it comes from
all the sunsets and sunrises around the edges of the
silhouetted Earth.
Close to the shadow's edge, the bluer light is still
filtered through Earth's atmosphere, but
originates as rays of sunlight pass through layers high in
the upper stratosphere.
That light is colored by ozone that absorbs red light
and transmits bluer hues.
In this sharp telescopic view of totality from Auckland, New Zealand,
planet Earth, the Moon's north pole has been rotated to the
top of the frame.
Image Credit & Copyright: Rolf Olsen
Sunday, April 12, 2015
The Nitrate Runoff Problem in Iowa, and its Costs

As Des Moines Water Works pursues a lawsuit against upstream county drainage districts, it outlines the costs of and desired improvements to its nitrogen removal equipment:
Des Moines Water Works says it spent $540,000 this winter — and another $500,000 in 2013 — to run its nitrate removal facility.The Des Moines Register has a number of stories about nitrate runoff from Iowa farms. The main sources:
Altogether, nitrate levels at the utility intake exceeded federal drinking limits 1,636 days between 1995 to 2014 — 24 percent of the time. The agency has run the nitrate removal facility 673 days over those 19 years. That's about 10 percent of the time.The utility says it's looking to invest up to $183 million over the next five years to replace the existing denitrification plant, "due to its age and the limited capacity."The agency anticipates it will need to build a nitrate removal plant with a "50 million gallon per day capacity," five times the existing plant's capacity, according to its lawsuit over high nitrate levels.Bill Stowe, the CEO of Des Moines Water Works, said the utility's denitrification capacity is likely closer to 15 million gallons per day, depending on the water temperature and nitrate levels. The utility needs to build a plant to handle growth over the next 20 to 25 years and to meet stricter nitrate removal standards, he said.He also anticipates federal drinking water standards could be cut by half in the future.
Two factors have given rise to Iowa's high nitrate levels, research shows:It's hard for this Ohio farmer to imagine soil so rich in organic matter that large amounts of nitrates leach out all winter. So do Iowa farmers still apply a lot of anhydrous ammonia in the fall and winter for the next year's corn crop, or have they moved to more nitrogen application by sidedressing during the growing season?
• Drainage tiles, which help make about 12 million acres of Iowa land farmable, enable nitrogen that's both applied and in the soil organically to move much more quickly into Iowa rivers and streams.
• Massive row-cropping, which has put roughly two-thirds of Iowa land into farm production, also is elevating nitrate concentration in the state's waterways, say Schilling and others. And the loss of perennial crops such as alfalfa in many farmers' rotation plays a role in those rising levels.
In essence, the very elements that have made Iowa farmers the most productive in the world are responsible for elevating nitrate levels in the state's waterways....
Much of Iowa's nitrogen — and nitrates — are in the soil organically.
Iowa has about 10,000 pounds of organic nitrogen per acre, according to Iowa State University professors Matt Helmers and Michael Castellano. "To get a sense of scale, a farmer might apply 150 to 200 pounds of nitrogen per acre to a corn crop," said Castellano, an assistant professor of agronomy.
Each year, about 30 pounds of nitrogen per acre is lost, much of it from organic matter that's already in the soil, say Castellano and Helmers. Studies show about the same amount of nitrogen is lost regardless of whether farmers grow corn or soybeans, which requires no nitrogen application.
"There's no statistical difference," Castellano said.
Nitrates occur when Iowa's rich soils get warm and wet, and microbes convert nitrogen — both that farmers apply and what's available organically — into nitrates, which plants use to grow.
Problems occur, though, when there are no plants in the fields to soak up the nitrates — particularly in the spring and the fall — allowing them to seep into waterways, said Castellano and Helmers, an agricultural biosystems engineer.
It's why leaders have pressed farmers to adopt conservation practices such as cover crops. Cereal rye and other crops can help soak up nitrates before Iowa's massive corn and soybean crops are too young to do it in the spring — or ready to be harvested in the fall, the ISU professors say.
Subscribe to:
Posts (Atom)